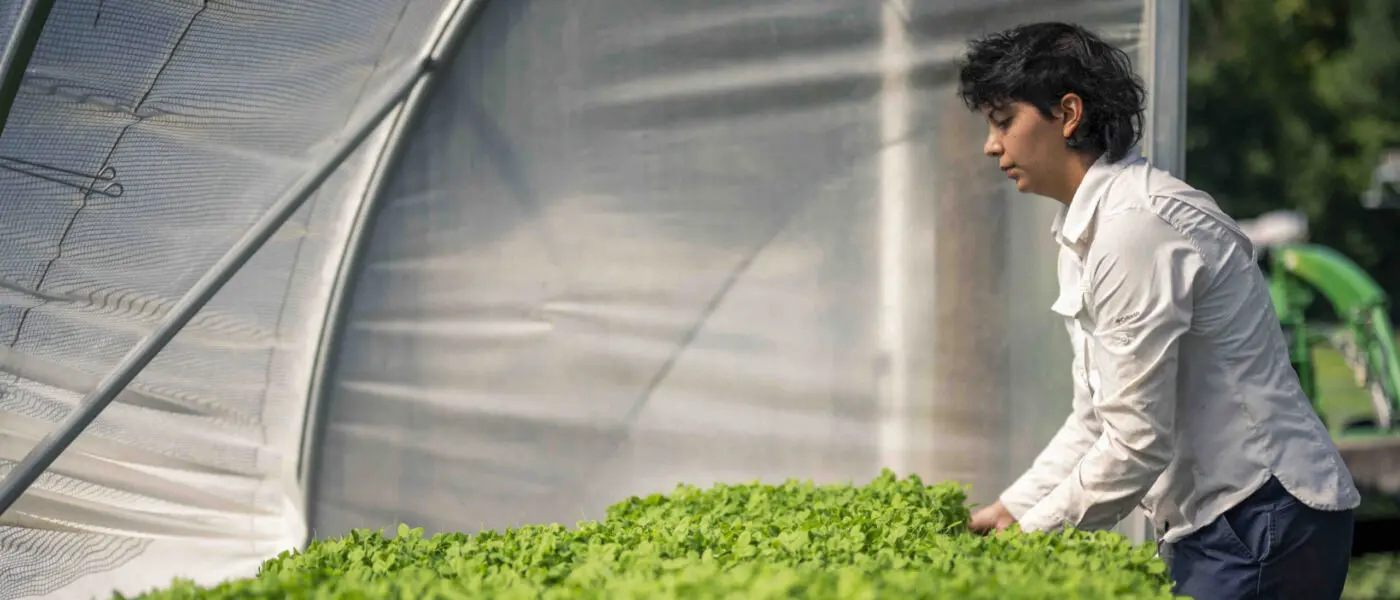
The very first Census of Agriculture was issued back in 1840, under President Martin Van Buren’s administration. While American farming looks quite different than it did back then, the historic tradition of gathering information from farmers and farm families lives on. Every five years, the U.S. Department of Agriculture completes a Census of Agriculture, and for food and farm geeks like those of us here in the Farm Aid office, its arrival is an exciting time when we get a more thorough snapshot of farming across the country.
So what is the state of our agricultural nation? How are our family farmers faring? Here are the top 10 things we’ve learned from the newly released 2012 Census of Agriculture:
1. We are still losing American family farms
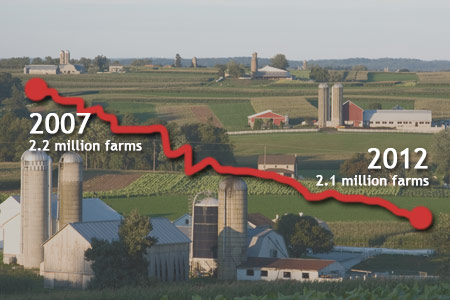
Despite a growth in the number of farms reported in the last ag census in 2007, the 2012 census showed a loss of about 95,500 farms, or 4%. With 2.1 million farms today, we have to ask: will this trend continue? That depends on several factors, but of central importance is whether farmers receive a fair price and make a fair living in our increasingly complex and corporate-controlled food system.
2. Which farms did we lose? All but the biggest.
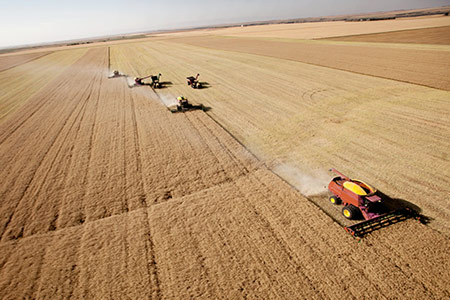
The number of farms earning over $500,000 increased by 33%.
Only the very largest farms (and we’re talking very large) increased in number. While all other categories of farms (as measured in acres), saw losses between 2007 and 2012, farms with 2,000 acres or more grew in number.
The story isn’t much different if we measure farms by their annual sales. There was a slight increase in the number of small farms with gross sales between $50,000 and $99,999 (just 3%), but otherwise all categories saw a loss – except again for the very largest farms. Farms earning $500,000 or more in gross sales jumped by 33% between 2007 and 2012.
3. Farmers enjoyed historically high farm sales… and expenses.

In 2012, farm sales increased 32.7 percent. But farm expenses increased even more, by 36 percent.
Census time usually ushers in headlines of boom times in farm country, but the experience of most farmers is usually more complicated, and often quite challenging. The 2012 Census showed another notable leap in the total value of farm products sold, indicating strong farm production and high prices received by farmers for the goods they produced. While the 2007 Census broke historical records for farm sales, the 2012 Census left that number in the dust, boasting $395 billion in sales — a 33% jump!
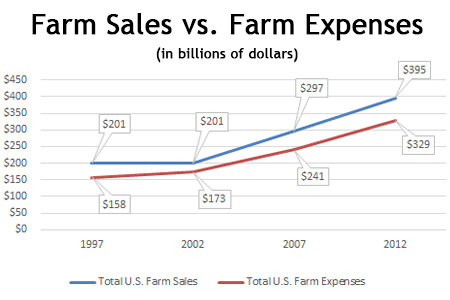
But there was a similarly giant leap in farm expenses, climbing 36% from $241 billion in 2007 to $329 billion in 2012. That means farmers are paying more than ever to keep their farms humming — particularly from hikes in feed costs, fertilizer purchases and fuel and pesticides expenses to a lesser extent. With profit margins remaining slim for the majority of farmers, it’s no wonder we saw farm losses.
4. Fewer farmers grow most of our food…

Even though most farms in the United States are small, most of the food produced and consumed in the country is concentrated on a relatively few, very large farms. In 2012, 75% of all farms had sales of less than $50,000, but these farms produced only 3% of the total value of farm products sold.
In contrast, farms with sales of $1 million or more — 4% of all farms — produced 66% of the total value. These numbers indicate a continuing trend of consolidation and concentration in the food and farming sector.
5. …but we are seeing a growth in alternative models.
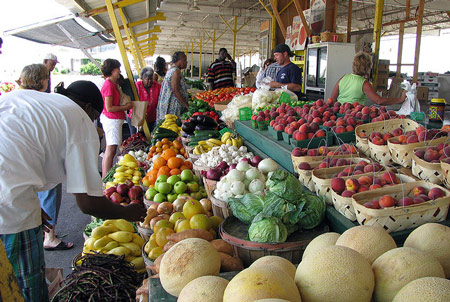
Direct sales total $1.3 billion, up 60% since 2002.
The 2012 census indicates a renewal in local and regional food systems, where consumers source their food closer to home, and farmers find viable markets in shorter supply chains. Direct farm sales (from farmers’ markets, farm stands, Community Supported Agriculture (CSA) programs and other markets) totaled $1.3 billion, up 8% from 2007 and 60% from their level in 2002 — showing a dynamic decade of growth. In 2012, 144,530 farms sold directly to consumers — 7% of all farms.
6. Organic is still growing.
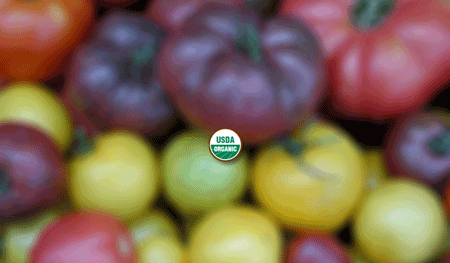
Sales from organic farms have increased 82% since 2007 to more than $3 billion.
While less than one percent of all U.S. farms are organic — 16,525 farms to be exact — the organic sector is maintaining steady growth and capturing a larger share of consumer dollars. Organic sales from farms increased by 82% since 2007, reaching $3.1 billion in 2012. California still boasts the highest number of organic farms, but new states are becoming players in the sector. Florida, Texas and Colorado are now on the top 10 list for organic sales, joining (the other 10 states).
7. One fifth of American farmers are beginners.

22% of farmers are beginning farmers who have operated a farm less than 10 years.
One of the biggest news items in the 2012 Census of Agriculture is beginning farmers. While the total number of beginning farmers has dipped since the last census, the number of beginning farmers under the age of 35 who report farming as their primary occupation increased by 11%. We salute the 40,499 young individuals who are taking up farming as their primary career and see that there is more work to be done to ensure the success of the next generation of American family farmers.
8. American farmers are becoming more diverse.
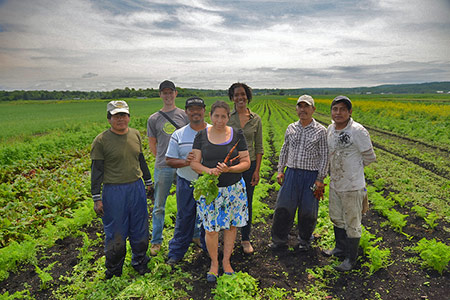
There are nearly 100,000 Latino farm operators.
The face of the American farmer is changing with a noticeable uptick in the diversity of our farmers. The largest increase was among Hispanic farmers — today 99,734 farm operators identify as Latino, an increase of 21% since the last Census. Most minority farmers fall disproportionately in lower sales classes — for example 68% of Hispanic, 78% of American Indian and 79% of Black farmers made less than $10,000 in farm sales.
9. We lost female farmers.

In 2012, 288,264 principal farm operators were women, a 6% decrease since 2007. However, women farmers still represent 30% of all farm operators in the country. The vast majority of women farmers operate small farms — 91% of farms with women as principal operators had less than $50,000 in farm sales.
10. Corn and soy reign supreme.
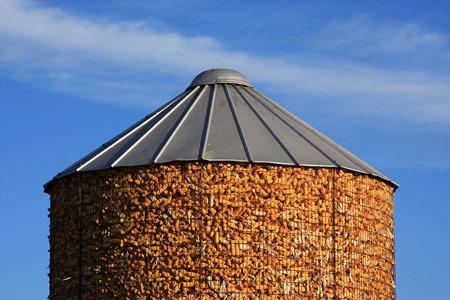
Corn and soy makes up more than 50% of harvested acres.
For the first time ever, corn and soybeans topped 50% of all harvested acres — meaning just two crops dominate half of our active farmland in the United States. In a time of high farm prices for these two crops, the country also saw a noticeable shift in the amount of pasture or rangeland that was used for crop production. Even though “permanent” grassland (for pasture or grazing) increased slightly between 2007 and 2012, the U.S. lost 65% of available land for pasture over to crops. In concert with this shift, the number of farms using chemical pesticides increased by 154,149.
Dig into the full 2012 Census of Agriculture on the USDA's site. Read more about corporate concentration in agriculture.Photo credits
1. Farms photo © Patty O’Brien
3. Barn photo © Patty O’Brien
4. Barn icon via Icons8
5. Farmers market photo by Natalie Maynor
7. Farmer photo © Alicia Harvie
7. GrowNYC‘s New Farmer Development program photo © Dietrich Gehring
9. Abbe Turner photo courtesy of Lucky Penny Farm
10. Photo © Patty O’Brien